
Measuring Your Fleet Operation
In order for us to measure our fleet operation, we need to lay out numbers that illustrate our activity via activity-based costing. This gives us a picture of what is happening in terms of our fleet productivity and resultant profitability. The photo seen below is an excellent example of basic information that doesn’t make sense until it is explained, which is one way activity-based costing can assist your fleet. If we put our finger on the number 1 in the photo, we then look sequentially for 2, then 3 and so on.
Try this exercise: Give yourself 30 seconds and see how far you get sequentially during that time. After the 30 seconds is up, determine the number you achieved. Look at the sheet – how are the numbers laid out? Draw an imaginary line down the middle of the sheet. Note that odd numbers are on the left side; even numbers are on the right. Knowing this layout pattern, if we do the exercise a second time, we will focus on a 4-inch-by-10-inch layout rather than an 8-inch-by-10-inch layout. That should increase our productivity by 50 percent. Now, repeat the exercise and measure your productivity improvement.
Case Study Review
Next, review the case study below. Let’s go through the 22 line items to lay out the condition of this fleet. These categories will give us a picture of our fleet and its productivity. I’ll explain the meanings of each line item and, after that’s done, we can look at the overall condition illustrated by these categories and the numbered value for each line item.
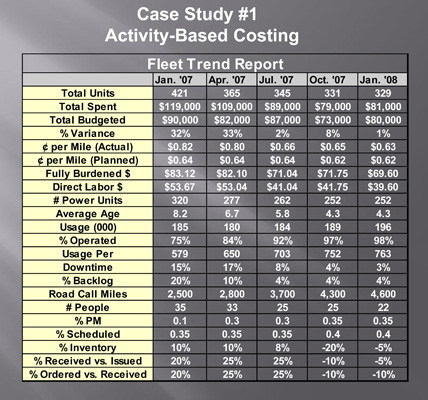
Column 2, Line 1 shows we have 421 vehicles. Line 2 states the total operating expenses are $119,000 for the month of January. In Line 3, you can see the operating dollars budgeted for the month are $90,000. Line 4 highlights an important point – that we are 32 percent over the operating budget for the month. Since we spent it, we have to get the extra spent money from somewhere. The money could come from another department’s savings or an advance from next month’s budgeted items, or it could be borrowed from a lender.
Line 5 indicates that our actual cost-per-mile average for our 421-unit fleet is 82 cents. In Line 6, you can see that our budgeted cost per mile for this month is 64 cents. Based on those figures, we are 18 cents per mile over our operating budgeted mileage cost. Line 7 shows that our fully burdened labor rate is $83.12 per hour. That includes direct labor plus benefits and all overhead such as heat, electric, supervision and clerical costs. This tells us that if an outside organization can do our maintenance and repair work for less than this number, they should be hired. Our shuttle time also needs to be included in the analysis.
Line 8 notes that direct labor is approximately $53 per hour, so if we pay our staff $15 dollars per hour for 2,080 hours per year (52 weeks x 40 hours per week), a third of that time is spent working on maintenance and repair tasks. Line 9 tells us 320 of the 421 vehicles are power units; the remaining 101 units are nonpower. In Line 10, you can see that the average age of the 421 units is 8.2 years. According to Line 11, 185,000 miles were accumulated for the month. We want that number to stay high because those are revenue miles that deliver our product and thus make money for the company.
Line 12 tells us that on average, 75 percent of the 421 vehicles are operating day to day, while 25 percent are not used. Line 13 indicates that each of the 421 vehicles averaged 579 miles this month (185,000 ÷ 421). However, if you divide 185,000 by 421, that equals 439, not 579. Don’t presume all your numbers are always correct; before you accept their accuracy, test the numbers and believe nothing until you have verified their integrity.
Line 14 shows that, of the 75 percent of the vehicles in operation, 15 percent are down. That means a net of 60 percent of the 421 vehicles are running; the other 40 percent are not running and probably are not needed. Line 15 tells us there is a 20 percent backlog of work waiting to be done, which indicates that the backup is excessive. There is a road call every 2,500 miles based on the information in Line 16. As we address our problems, we want this number to increase to validate our maintenance and repair efficiencies.
In Line 17, you can see that there are 35 staff members. Preventive maintenance (Line 18) is 10 percent of our workload, and scheduled work (Line 19) accounts for 35 percent. Line 20 tells us our parts and materials inventory is increasing 10 percent each month. According to Line 21, we’re taking in 20 percent more than we issue, which is one reason why our parts and materials are increasing 10 percent per month. Line 22 lets us know that we are ordering more than we need, supporting the fact that our parts and materials inventory is increasing 10 percent more than we need each month.
Corrective Actions
Now, what’s wrong here? We’re 32 percent over budget, but there are three activity-based numbers that tell us what to do to help correct our situation:
1. Forty percent of our vehicles are not needed. If we remove 100+ unneeded vehicles, the fixed costs of these vehicles will reduce our expenses.
2. Hopefully, most of these targeted reductions will be our power vehicles, which are more costly to own and operate than nonpower vehicles.
3. The third pertinent number is the average vehicle age. We want to remove older units since they are the most costly and least reliable.
Column 3 Review
Let’s review Column 3 to follow up on our corrective actions. We removed 56 vehicles from the 421 units, leaving 365 total units – a 13 percent reduction. Depending on your expertise and experience, some of you will remove 35 to 40 percent or whatever you’re comfortable with. That is fine, too.
Line 2 indicates expenses have dropped from $119,000 in January to $109,000 in April based on the reduction in vehicles, and in Line 3 you can see that the operating budget has been lowered an estimated $8,000. Line 4 shows that we’re still 33 percent over budget, but we’ll catch up next month – we have to reduce our budget for our reduced fleet. In Line 5, note that the actual cost per mile has gone down 2 cents, while Line 6 shows the planned cost per mile is steady.
The fully burdened labor rate has now dropped $1.02 per hour (Line 7) and direct labor is down 63 cents per hour (Line 8). In Line 9, note that power units are down by 43. Thirteen units are nonpower, which is good because power units are more expensive than nonpower units.
In Line 10, you can see the average age has dropped 1.5 years. That signifies the majority of the 56 units removed were older units. In Line 11, the revenue miles are holding relatively steady, so we’re not negatively impacting revenue. The percentage operated (Line 12) has increased 9 percent. More of our vehicles are being used, but we have more units to remove. Of 40 percent, 13 percent have been cleared out, so we have 27 percent to go. Usage per unit (Line 13) has risen from 579 miles (after testing the numbers, this should actually be 439 miles) to 650 miles. You will notice in Line 14 that downtime is still a problem; we need to take the time to prioritize and sequence our workload. However, backlog (Line 15) is down 10 percent, a positive event.
Road calls, per Line 16, now occur every 2,800 miles, a step in the right direction. Since a reduction in work requires fewer staff members, we are down two people since January (Line 17) who have hopefully been reassigned within the company. Line 18 shows that preventive maintenance is up from 10 percent to 30 percent of our workload. Scheduled work (Line 19) remains steady. Because Lines 20, 21 and 22 have not moved, we have to get the parts people up to speed. The fleet reductions are reducing the average age of the fleet, thus requiring fewer parts.
All in all, the numbers are falling in line with our corrective action. There are many problems that are responding to one corrective action – reducing the fleet by getting rid of older vehicles, thereby lowering the fleet’s average age.
Post-Audit Action Items
Generally, when an operational audit is completed, the following are common items that require corrective action. These items are listed in order of priority.
• Written policies and procedures are needed.
• Work standards and productivity measures are needed.
• Fleet size is too large.
• Management practices need improvement.
• Utilization and availability criteria are needed.
• Supervisors need training in participatory methodology.
• Communication upgrade on each level is needed.
• Quality must improve.
• Vehicle purchasing and procurement procedures need improvement.
• Transportation organizations need to look at centralization and decentralization strategies.
• Work scheduling needs to be quantified and upgraded based on frequencies, time, mileage and fuel use.
• Technical training is needed.
• Management by objectives needs to be implemented and upgraded.
• Look at in-house and outsource maintenance balance.
• Cost control systems need to be established and implemented.
About the Author: John Dolce is a fleet facility and maintenance specialist employed by Wendel Companies, an architectural and engineering firm. He is an active consultant, instructor and fleet manager with more than 40 years of experience in the public and private sector. Dolce has written three fleet-related textbooks and teaches fleet management courses at the University of Wisconsin’s Milwaukee and Madison campuses.